
Free visual browser of the epigenome
Scientists at the Institute for Research in Biomedicine (IRB Barcelona) have developed a software application, chroGPS, which serves to facilitate the analysis and understanding of epigenetic data and to extract intelligible information. The software can now be downloaded for free from www.bioconductor.org.
In the last 15 years, researchers have generated a large amount of information about the epigenome: proteins, factors and epigenetic markers which, when bound to DNA, regulate gene expression. Projects such as ENCODE (for humans and mice) or modENCODE (for other lab model systems) have been devoted to collecting these data in order to analyse and interpret them in the framework of genomic data and to form hypotheses about functions and relations. But tools are still needed to extract functional and relational information about the epigenome and to present the results in a visual manner.
“With chroGPS, we wanted to integrate epigenetic data with genetic data to reap the great benefits from them and to be able to understand this information,” said Ferran Azorín, head of the Chromatin Structure and Function lab at IRB Barcelona. The tool emerged from dialogue between Azorín’s group, through the PhD student Joan Font-Burgada, and the bioinformatician Òscar Reina, a member of the institute’s Biostatistics and Bioinformatics Unit.
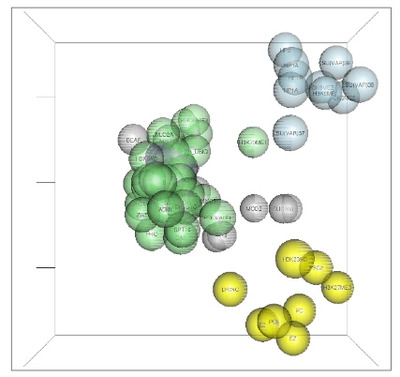
“chroGPS is based on the sequential application of two steps,” said Reina. “First, the generation of distances (or degrees of similarity) between epigenetic components on the basis of several possible measurements that we have developed; and after, in the representation of these distances in the form of bio tridimensional maps to facilitate their interpretation. For example, they are like visual maps from which distance tables can be drawn up in kilometres between cities.”
Writing in the journal Nucleic Acids Research, the researchers said their study used “data from the modENCODE project on the genomic distribution of a large collection of epigenetic factors in Drosophila, a model system extensively used to study genome organisation and function”. Azorín said the team “reached the same conclusions as those presented in Nature by researchers working on the modENCODE, but the enormous difference is that instead of seeing the information in hundreds of graphs and figures like in modENCODE, we have achieved a single map”.
Among Azorín’s latest aims for chroGPS, he hopes to follow the complex transformation of a healthy cell into a cancerous one through tracking the genetic and epigenetic changes that occur. This will require the researchers to take new steps in statistical and mathematic methods.
Australia signs AI collaboration agreement with Anthropic
To build on the National AI Plan launched last year, the Australian Government has signed a new...
Beckman Coulter Life Sciences announces Automata partnership
Beckman Coulter Life Sciences has announced a strategic partnership with Automata — to...
AI spots hidden objects in chest scans
A new artificial intelligence (AI) tool can spot hard-to-see objects lodged in patients'...


