
Old voyage provides new insight into global warming
Monday, 27 May, 2013
Over a century ago, the HMS Challenger set out on the world’s first global scientific survey of life beneath the ocean surface. Now, researchers at the University of Tasmania’s Institute for Marine and Antarctic Studies (IMAS) have used this data to attribute the ocean’s rising temperature to human-produced global warming.
The Challenger expedition covered four years and 68,000 nautical miles. During the voyage, scientists measured ocean temperatures by lowering thermometers hundreds of metres deep on ropes made from Italian hemp. Data from the expedition was published by the Royal Society as the 50-volume ‘Report Of The Scientific Results of the Exploring Voyage of H.M.S. Challenger during the years 1873-76’.
The Scripps Research Institute in California recently analysed the report, comparing its findings with more recent oceanographic data. They passed their results on to the University of Tasmania’s Institute for Marine and Antarctic Studies (IMAS), who took on the task of trying to explain the differences between the two, ie, what could be attributed to natural variation and what could not.
The newer data came from the Argo Project - a network of robotic floats which have been monitoring the world’s oceans since 2004. The instruments measure factors such as temperature and salinity once every 10 days and upload the data to a satellite.
The researchers also drew on climate models from the Coupled Model Intercomparison Project Phase 5 suite of simulations. These showed how the world’s oceans have changed since the Challenger’s voyage and helped assess the extent to which the temperature difference could be attributed to a long-term warming trend.
“The key to this research was to determine the range of uncertainty for the measurements taken by the crew of the Challenger,” said study co-author Dr Josh Willis, a climate scientist at NASA’s Jet Propulsion Laboratory. This is because the Challenger faced certain limitations in terms of the geographical area it covered, its measurement techniques and any natural temperature variation in each region it visited.
Could the IMAS team usefully compare the two observations and still get signal variability?
“The answer is, yes we can,” said lead author Dr Will Hobbs, a researcher at IMAS and the ARC’s Centre of Excellence for Climate System Science.
“Our research revealed warming of the planet can be clearly detected since 1873 and that our oceans continue to absorb the great majority of this heat.
“Currently scientists estimate the oceans absorb more than 90% of the heat trapped by greenhouse gases, and we attribute the global warming to anthropogenic causes.”
“It became apparent that the rate of warming we saw across the oceans far exceeded the degree of uncertainty around the measurements,” noted Dr Willis.
“So, while the uncertainty was large, the warming signal detected was far greater.”
In fact, to get reliable results the researchers used the most conservative estimates after taking into account the maximum possible variation caused by these uncertainties.
“A simple analysis of our results suggests we may have underestimated the warming by as much as 17%,” said Dr Hobbs.
“Many of the stations most prone to bias were in the Eastern Pacific - a region showing one of the strongest ocean warming trends - so the true warming may be even larger than that.”
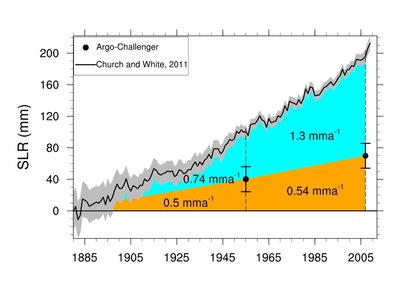
The researchers also found the thermal expansion of seawater caused by this global warming contributed to around 40% of the total sea level rise seen in tide gauges from 1873 to 1955. The remaining 60% was likely to have come from the melting of ice sheets and glaciers.
So why did it take so long for someone to use the Challenger’s data for climate change research?
“I think the oceanographic community is glad someone did it - they just didn’t want to do it themselves,” suggested Dr Hobbs.
The study ‘Detection of an observed 135 year ocean temperature change from limited data’ has been published in Geophysical Research Letters and can be viewed here.
Could this human tissue biobank find the cause of a bowel cancer surge?
In a new Australian biobank, lab comparisons of tissue donated by cancer patients will explore...
Microscopic life is mining decades-old toxic waste
At abandoned Flinders Ranges mines, stable radioactive and toxic metals are being turned into...
Dual-bubble approach achieves microplastic removal rates of over 90%
Using a combination of microbubbles and nanobubbles, Australian scientists have developed a...


